
IX Design
Mobile app strategy/design, websites, landing pages & branding:
1) Logo design, branding and style guides
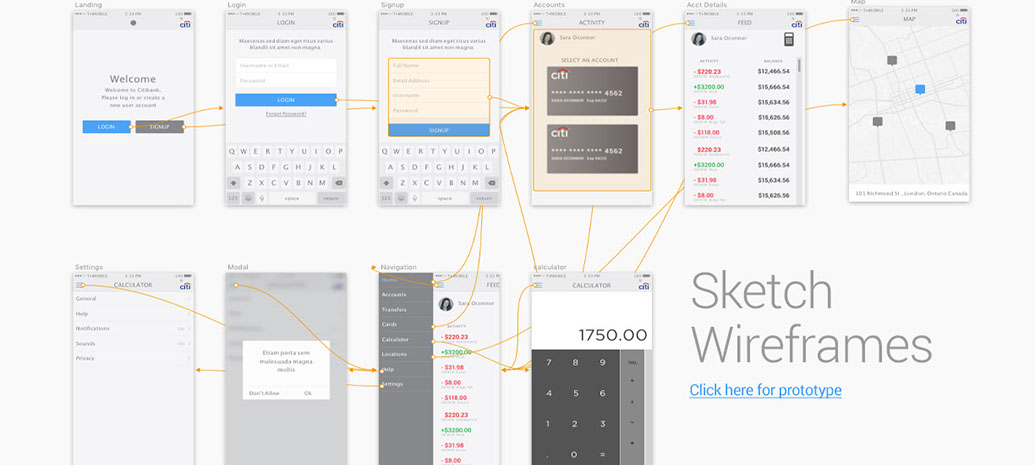
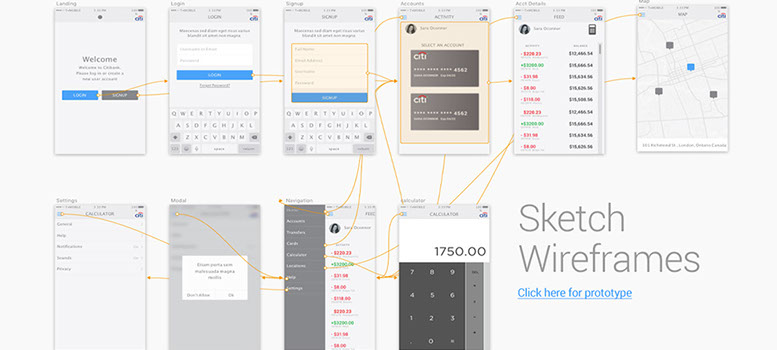
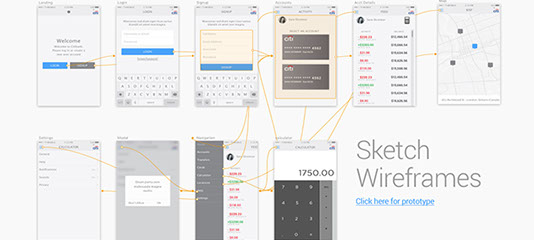
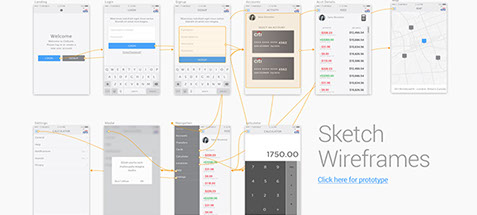
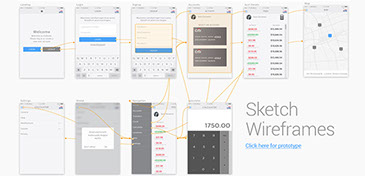
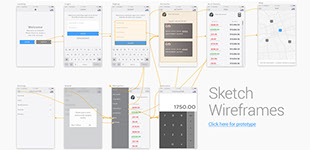
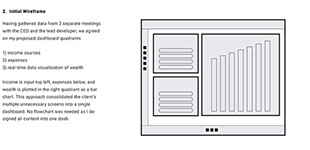
2) Wires/flows for strategy and user paths
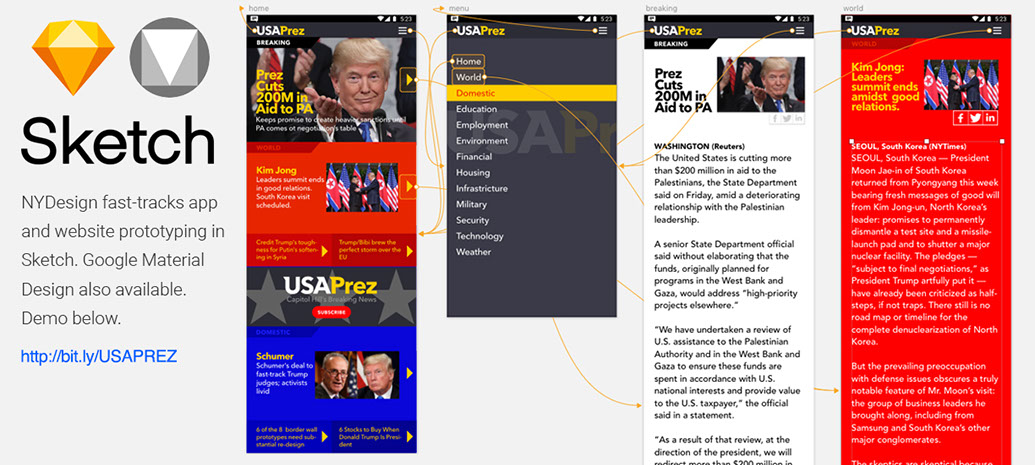
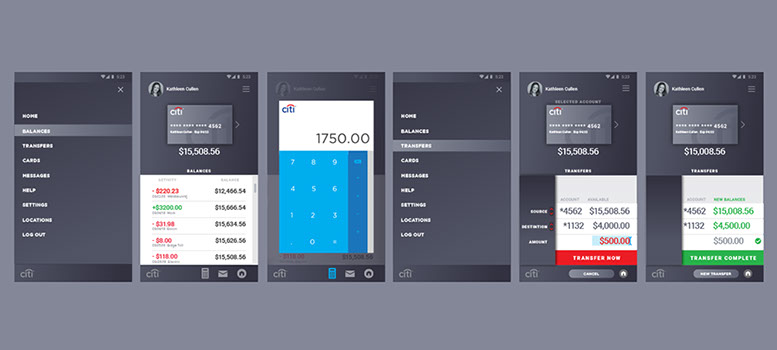
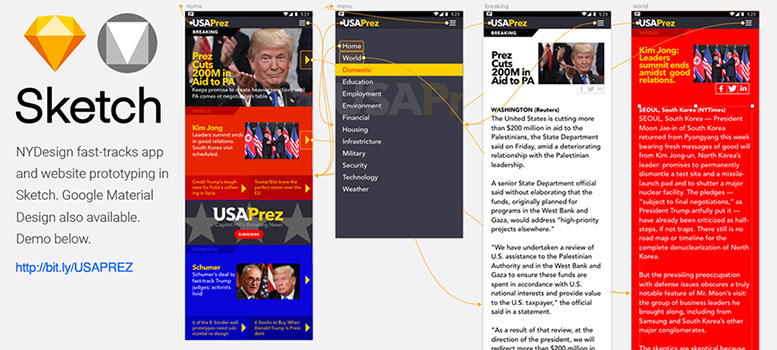
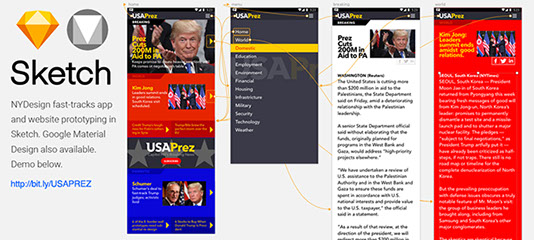
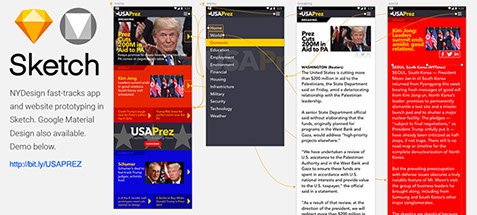
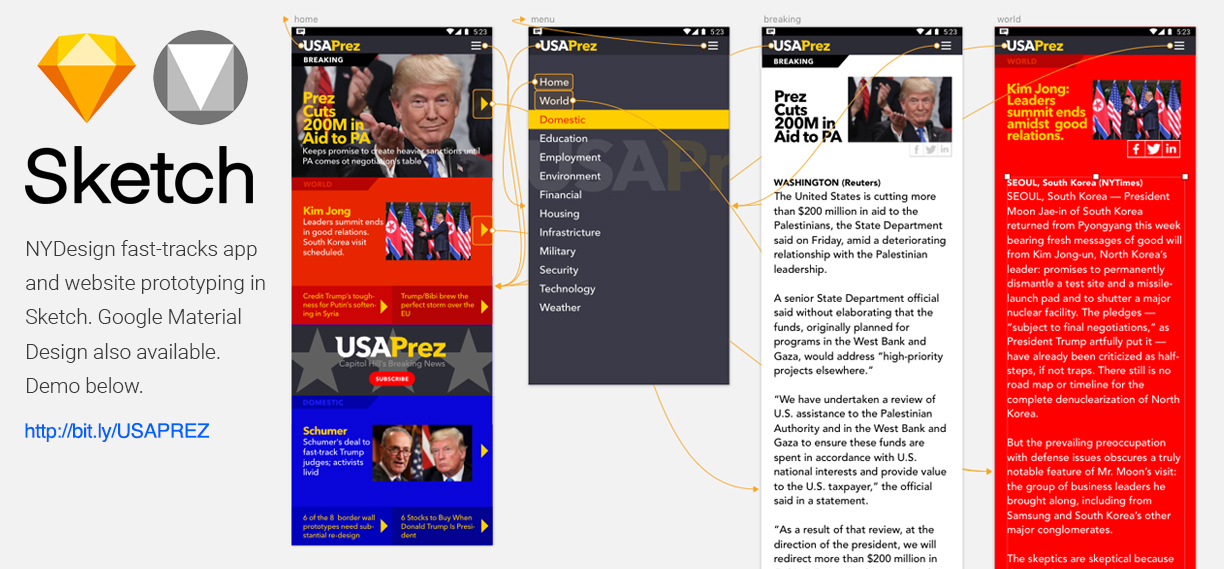
3) Prototyping: InVision, Sketch, Figma, Adobe XD
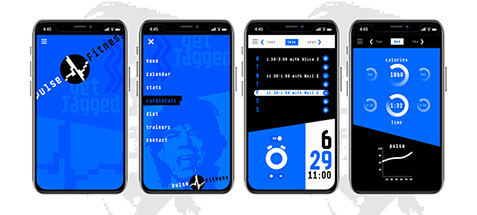
4) Iconography, animations, screen transitions, animation
5) Art direction of programmers to realize the design vision, from beta through the final version
6) PowerPoint developed for stakeholder approval, investor decks and other marketing needs
7) Playstore and social media page promotion.
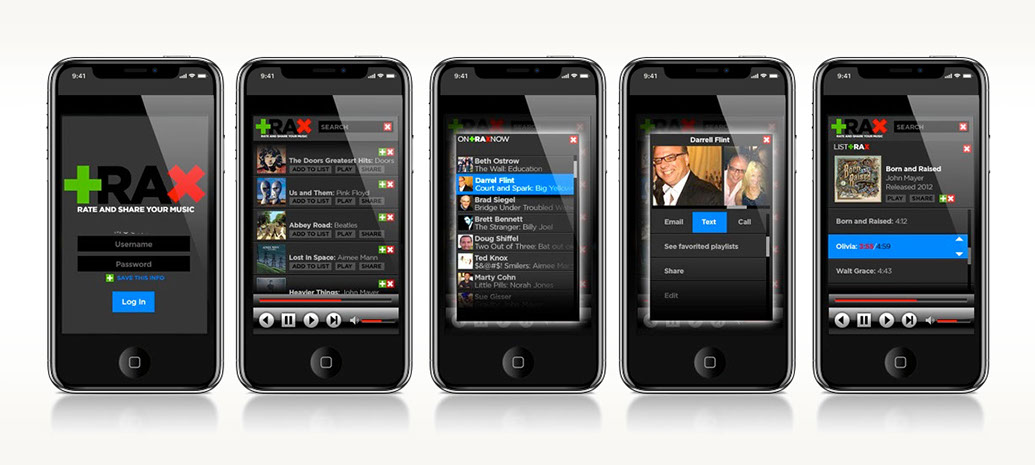
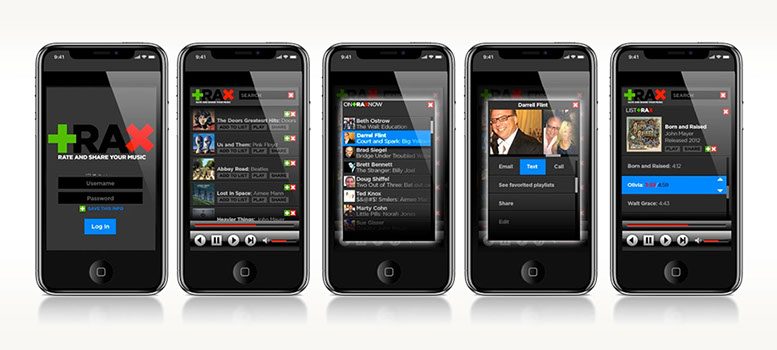
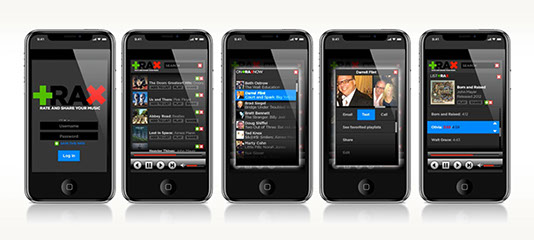
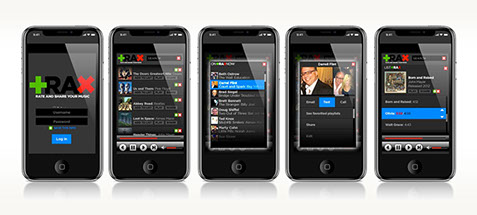
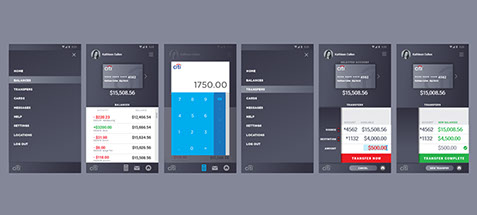
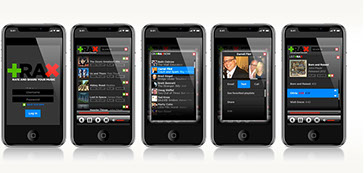
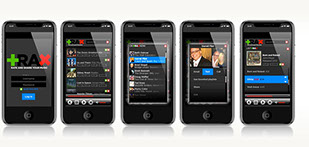
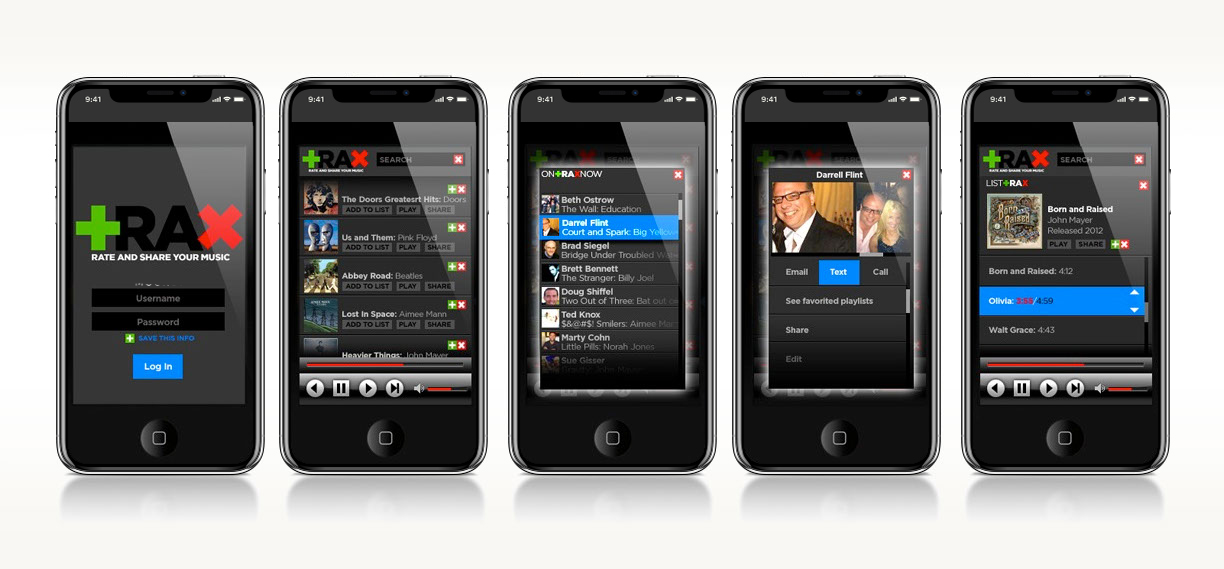
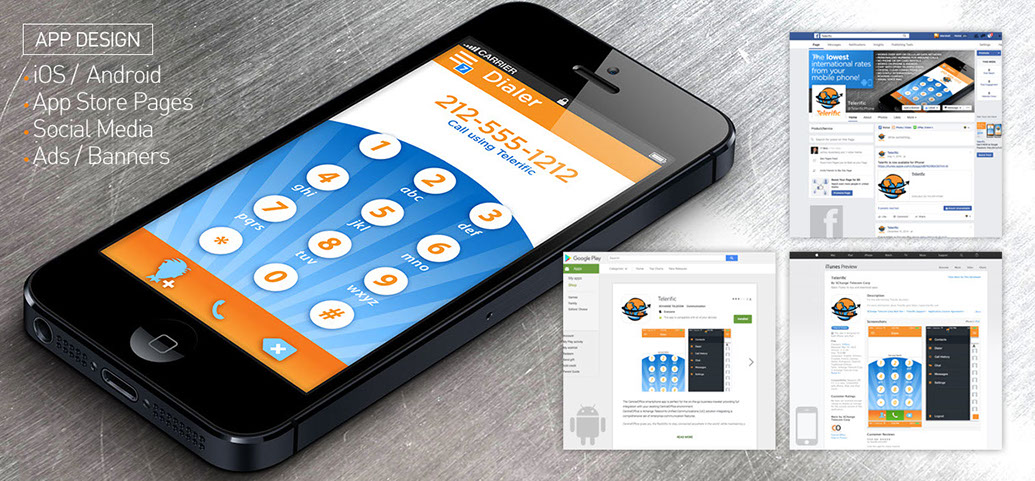
See shipped apps: Telerific CentralOffice
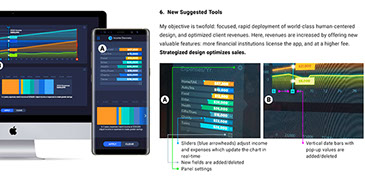
On all projects, the focus is optimized sales. This is achieved through articulating and conveying your competitive advantage and value in a compelling and succinct fashion. Visuals are key, and include: a strong identifiable brand, brand cohesiveness, content strategy, navigation, screen layout, animations, imagery, typography and color, which have earned NYDesign awards and has peaked client sales.
Contact NYDesign with your current design needs.
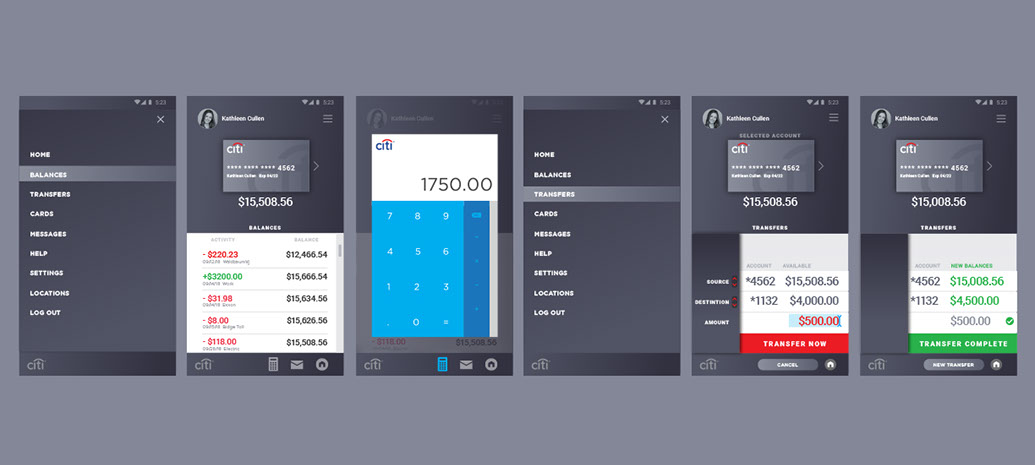
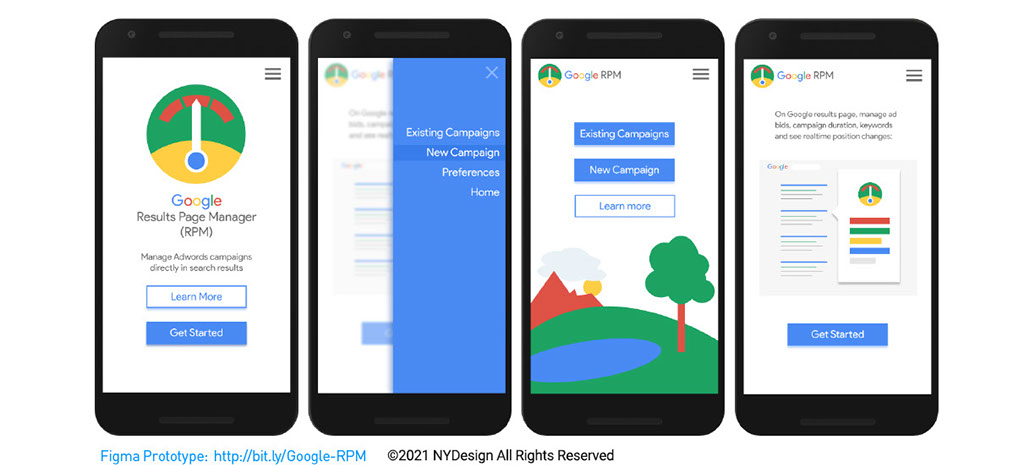
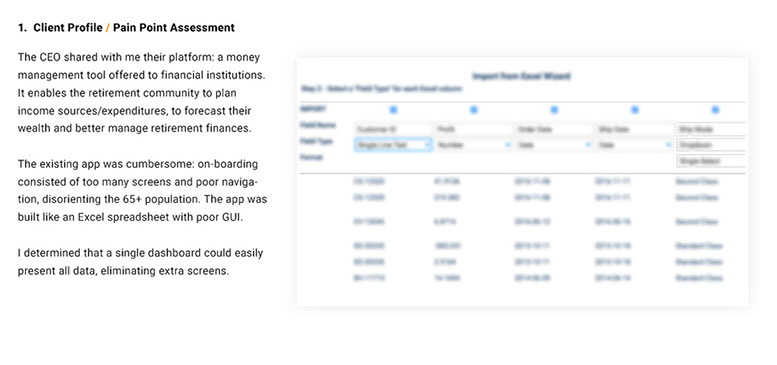
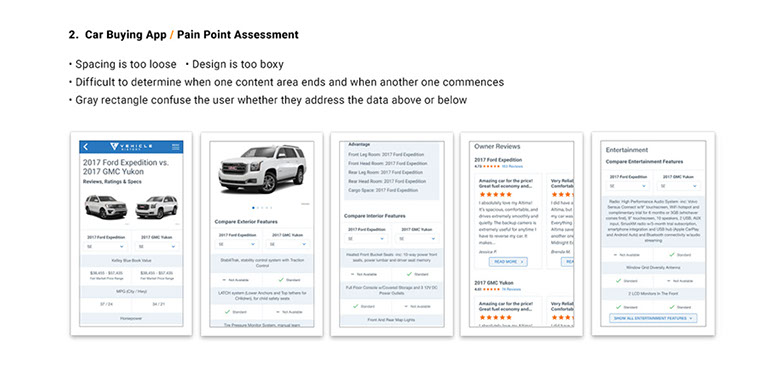
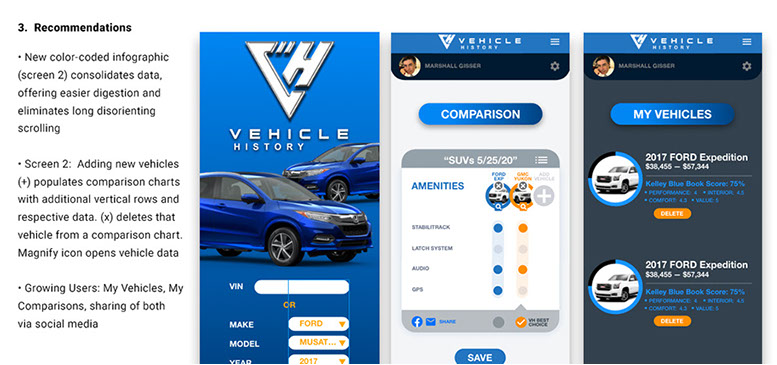
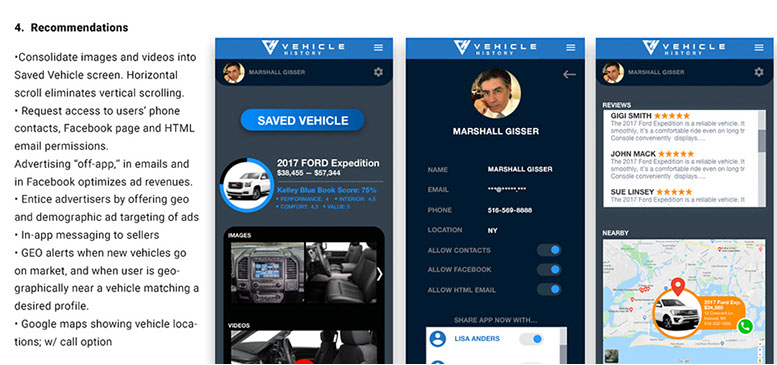
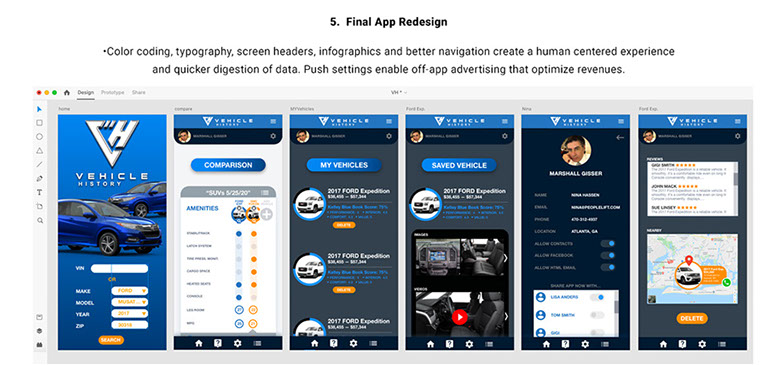
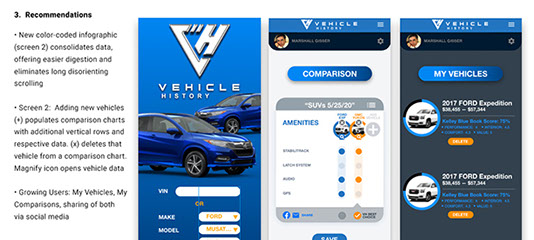
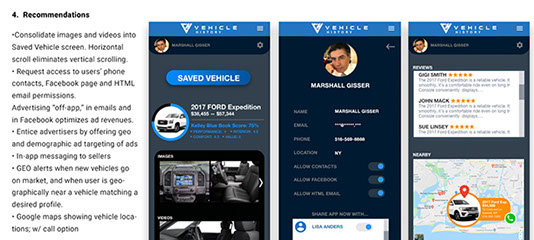
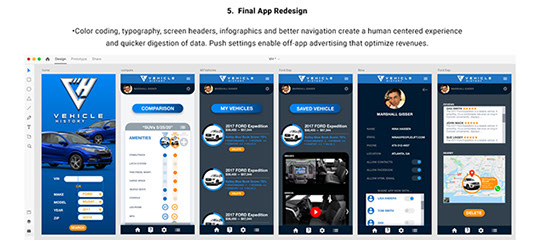
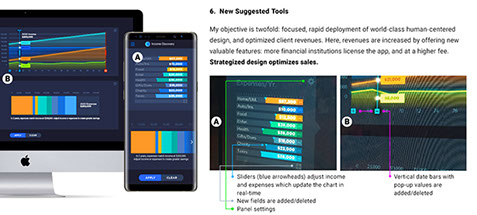
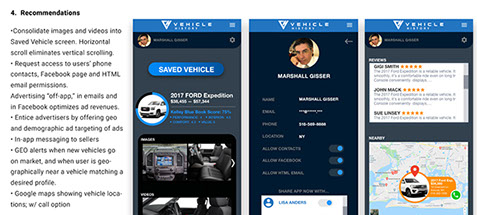
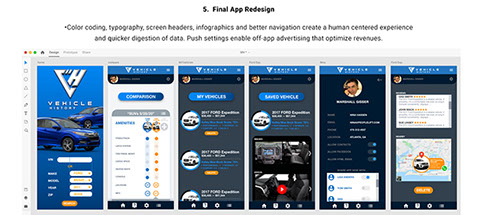
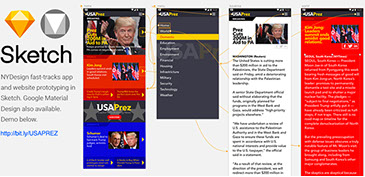
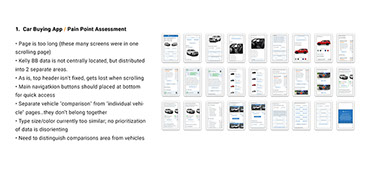
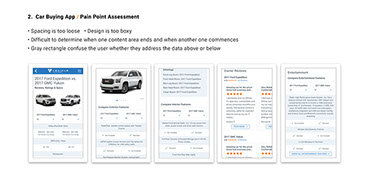
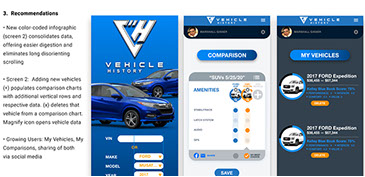
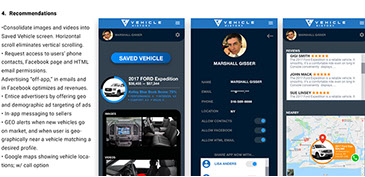
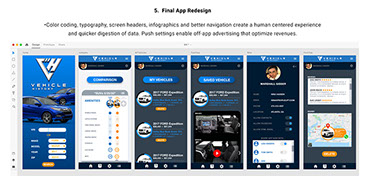
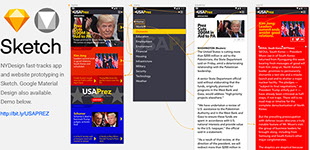
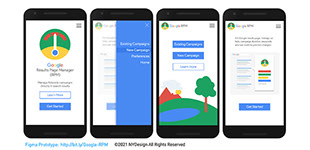
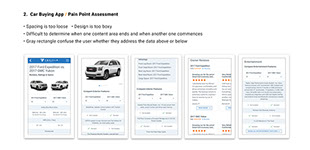
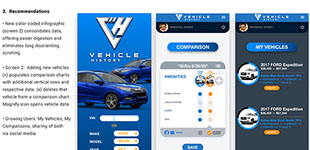
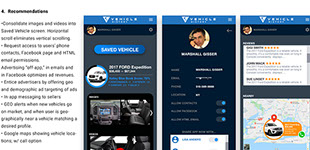
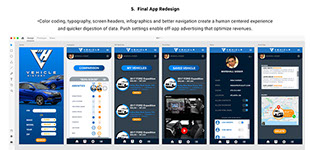
NEW Case Study
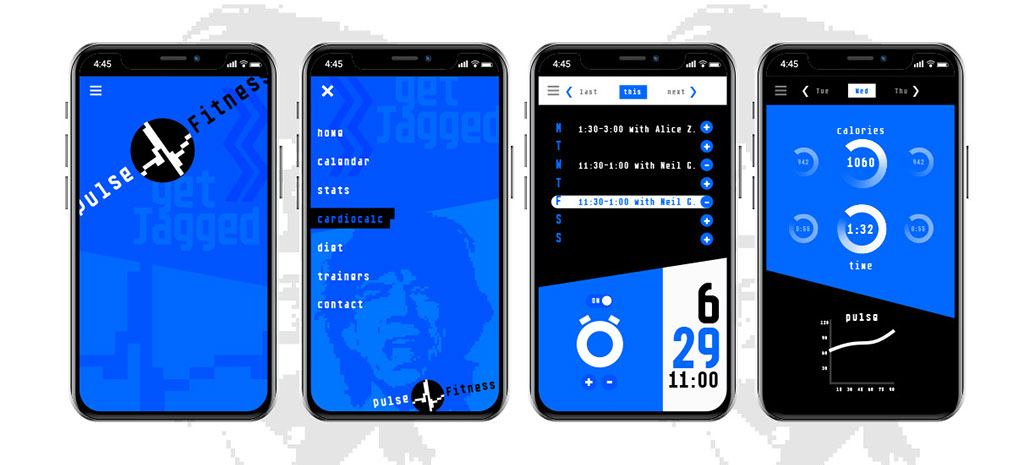
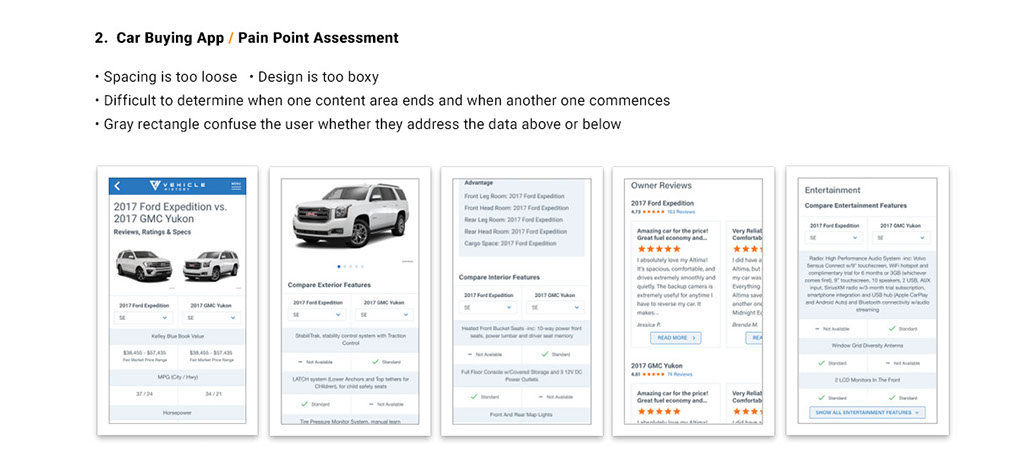
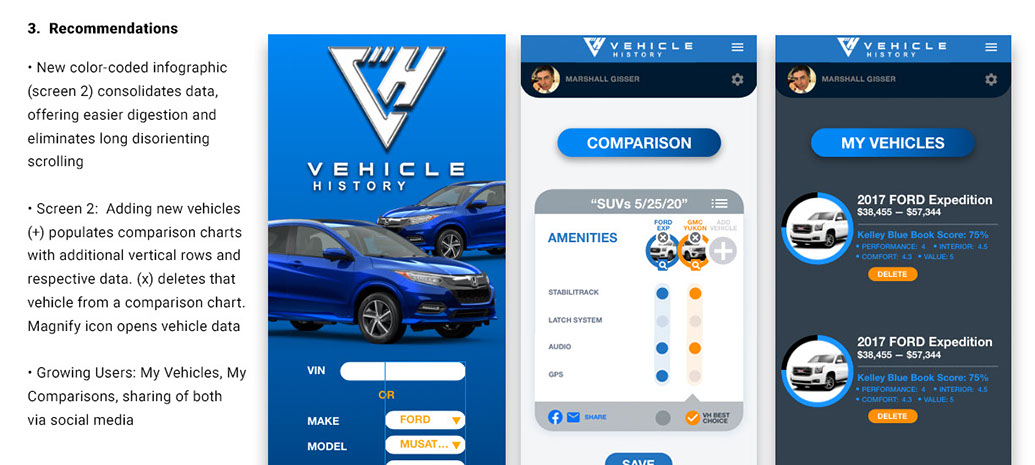
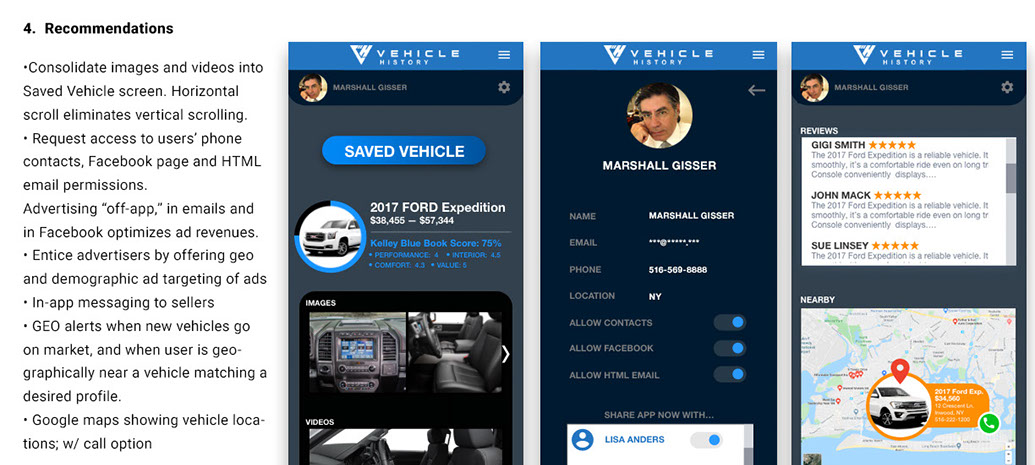
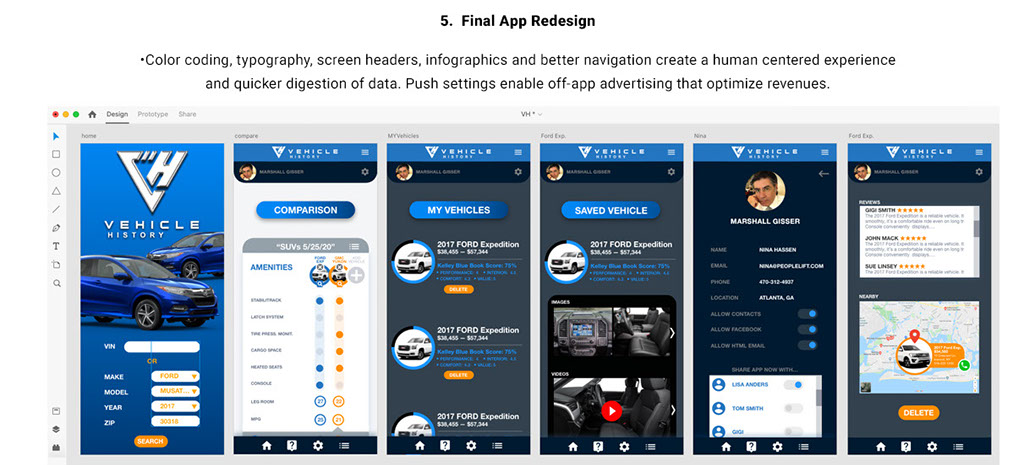
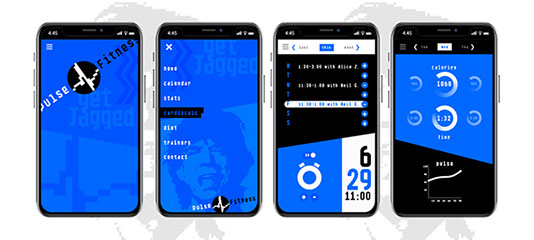
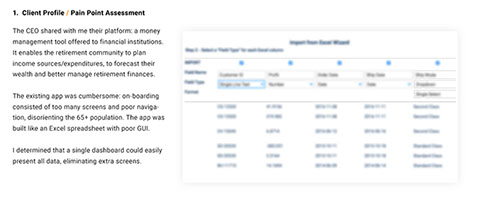
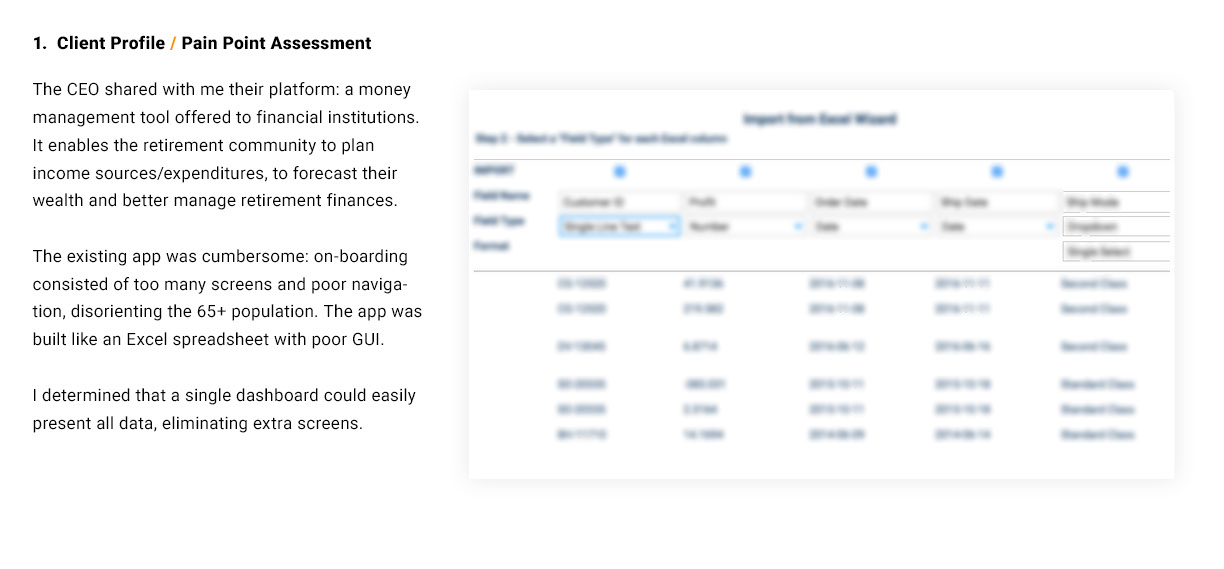
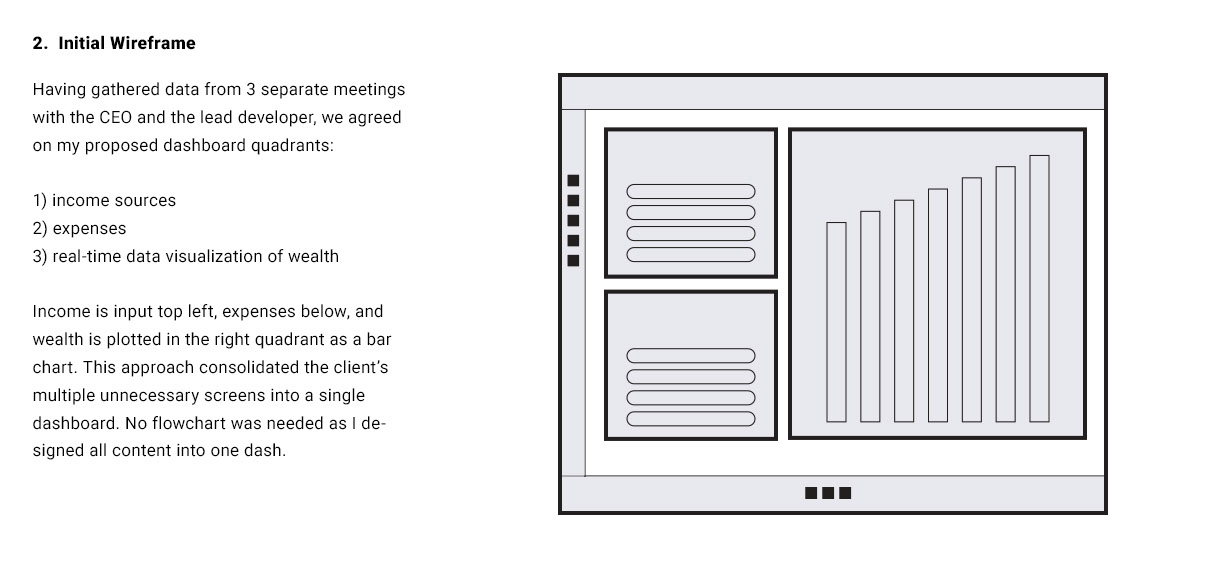
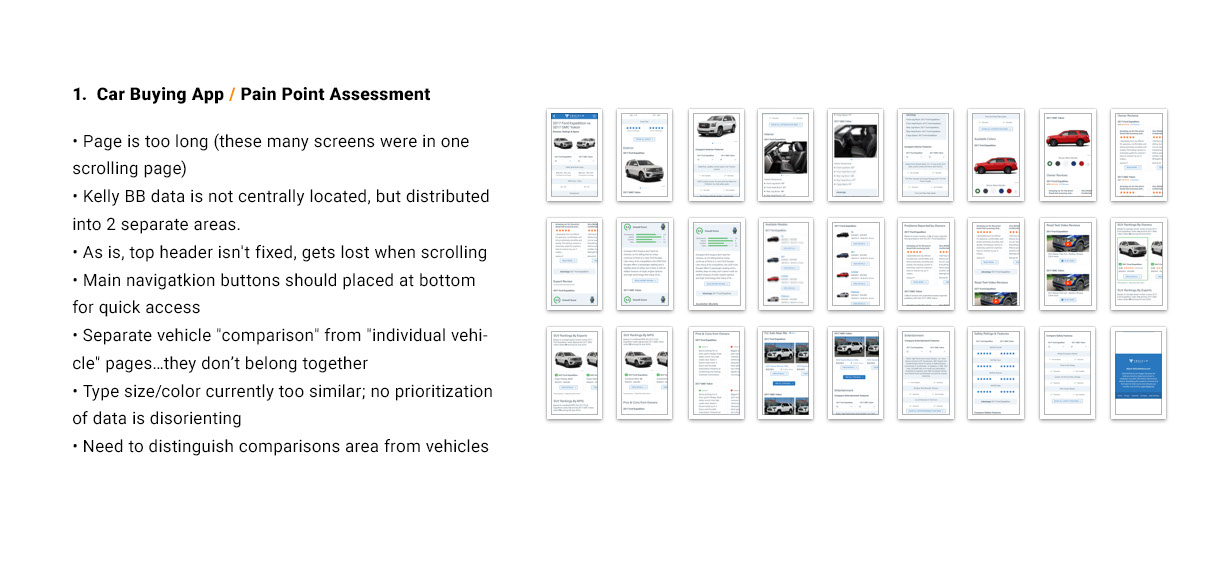
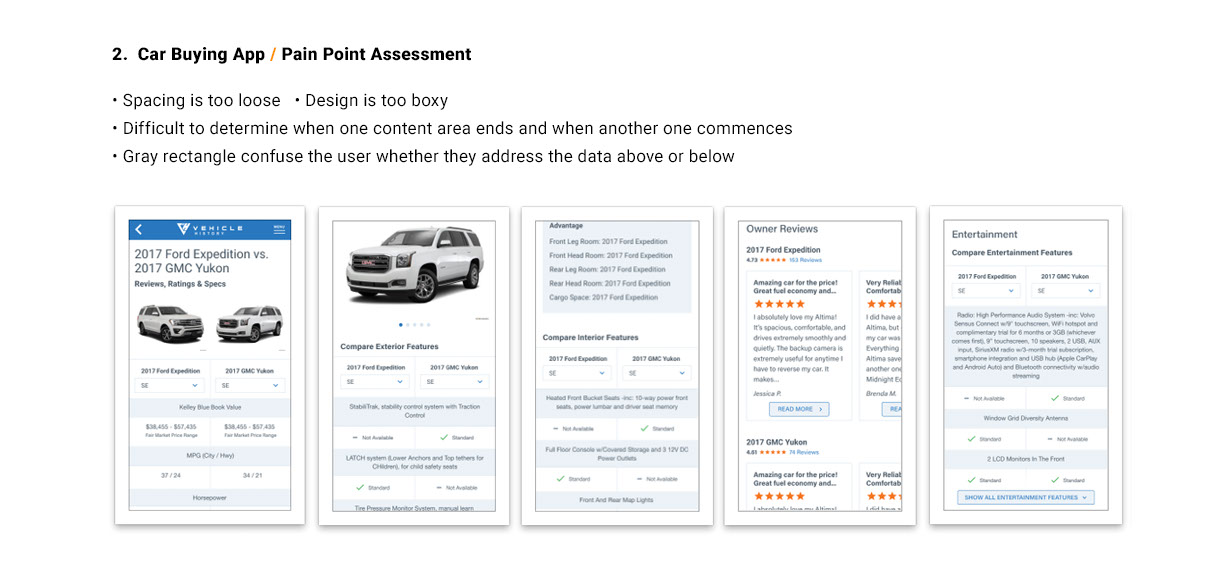
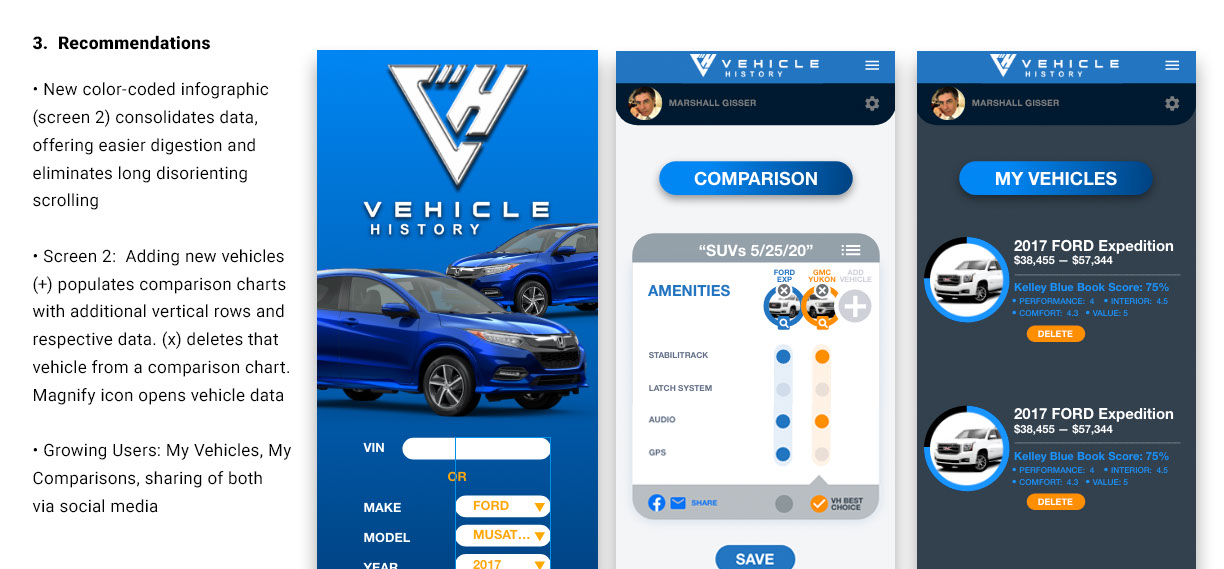
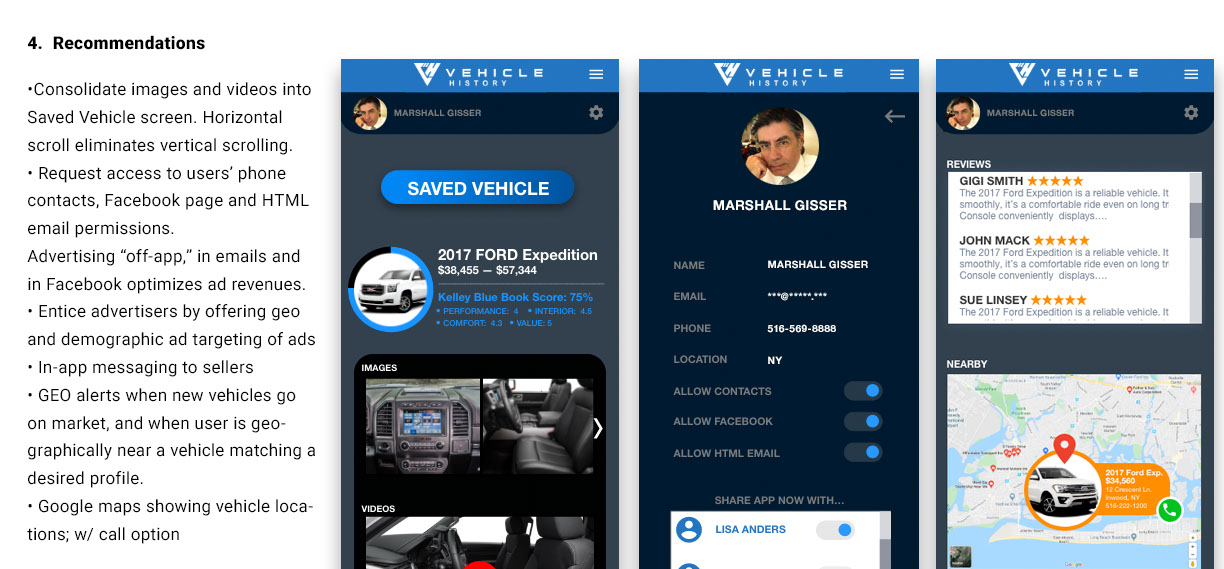
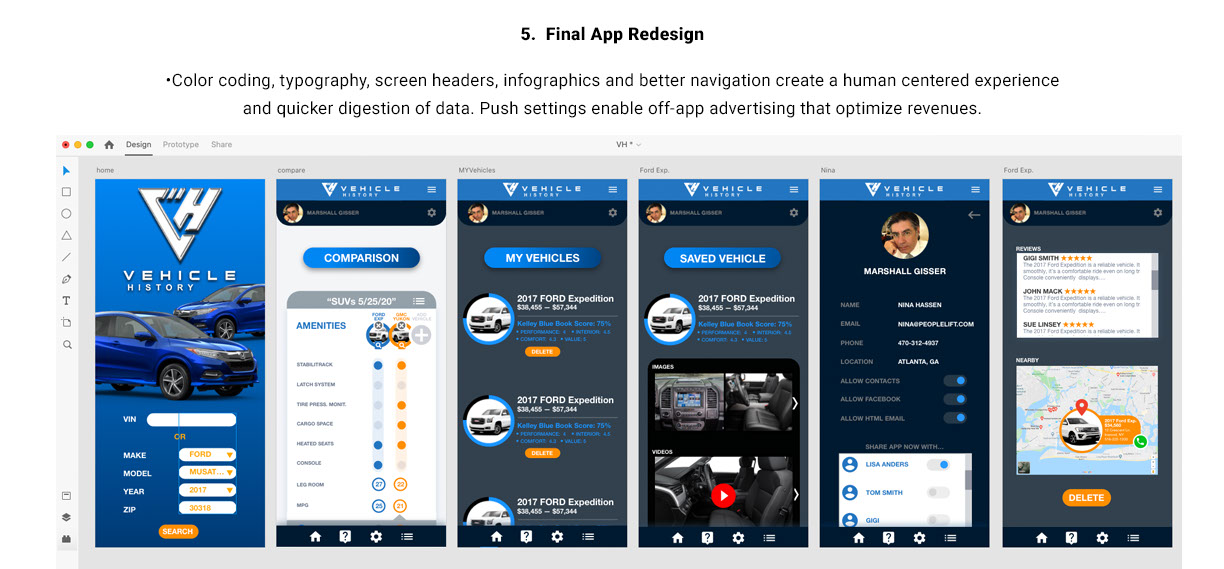
User-centered design; optimizing client sales (large image below)
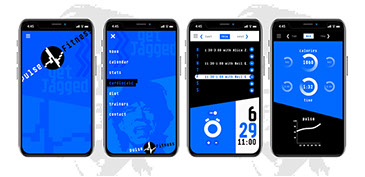
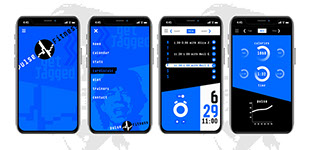
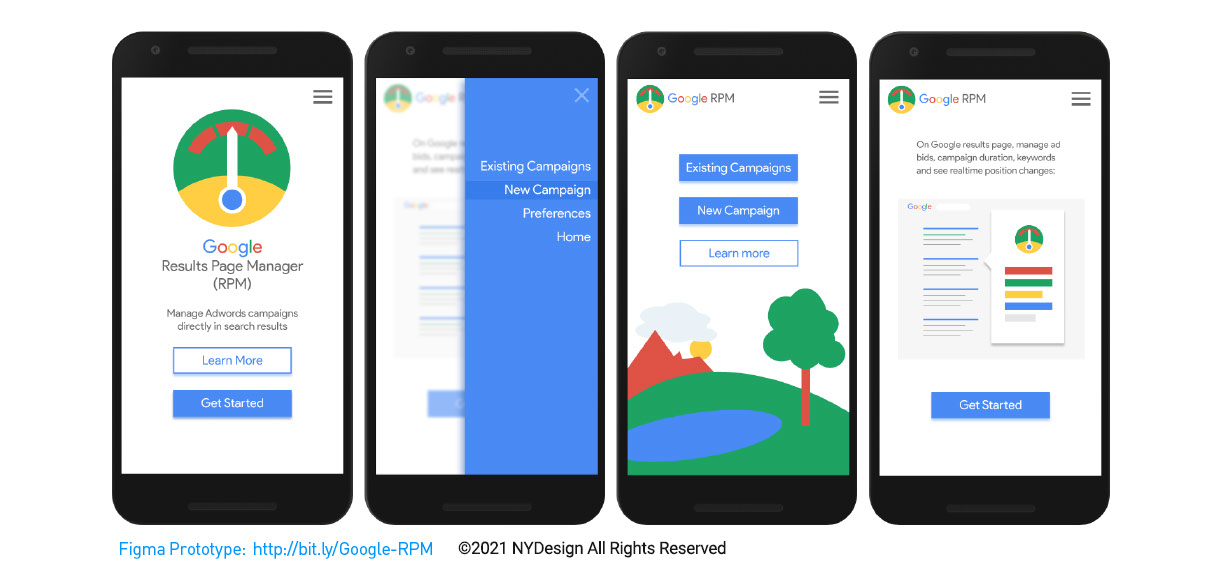
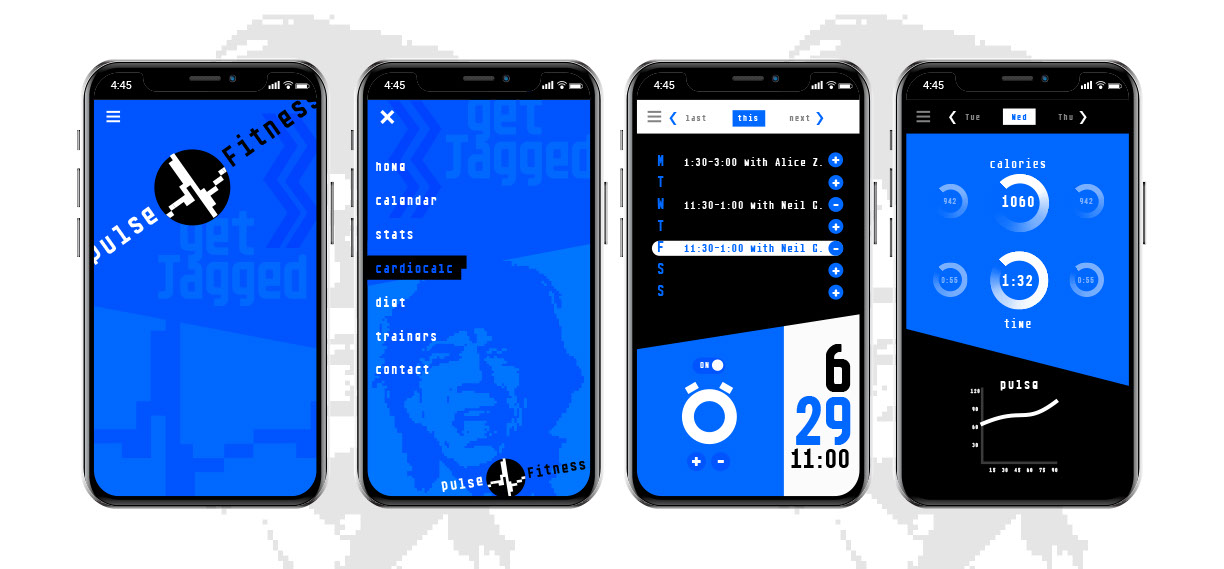
NEW Adobe XD
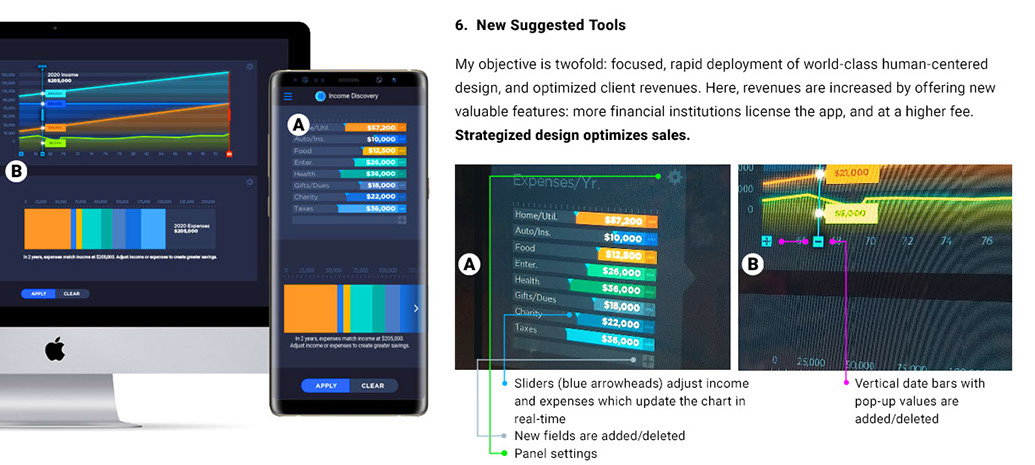
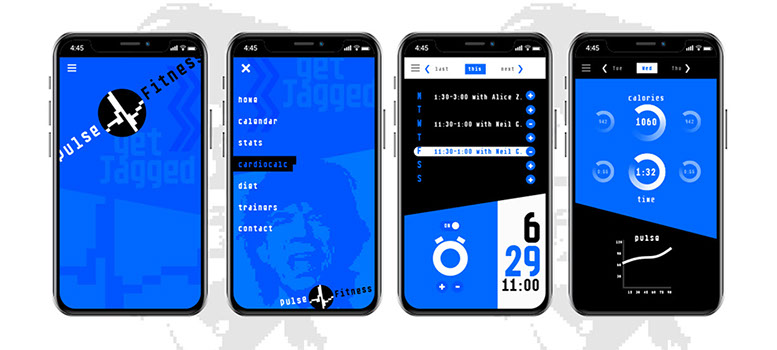
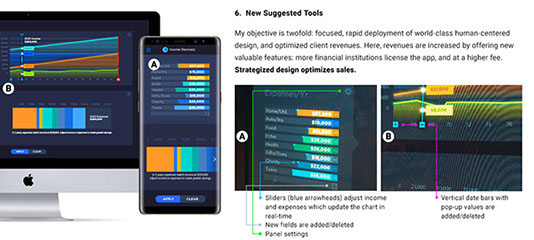
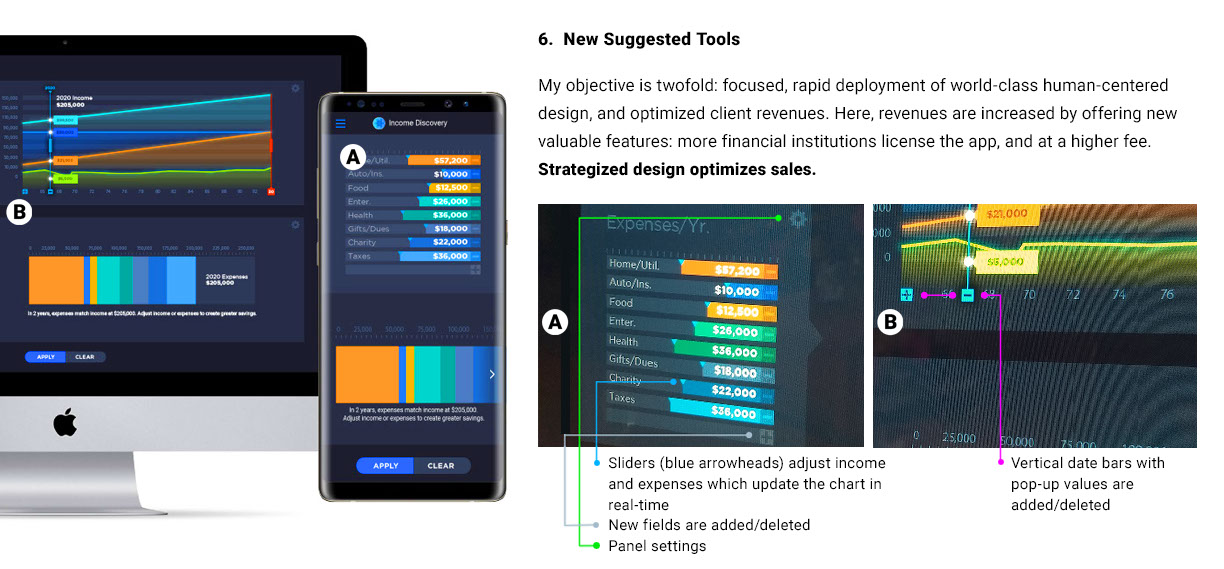
Optimizing sales gets granular: Micro interactions and app animations offer users robust and engaging experiences that drive sales.
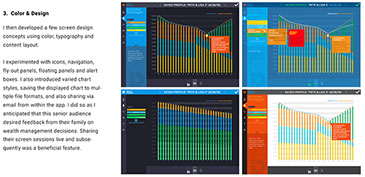
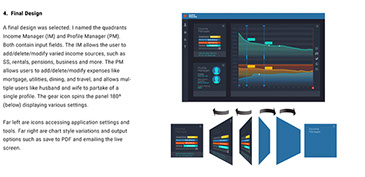
IX Innovation:
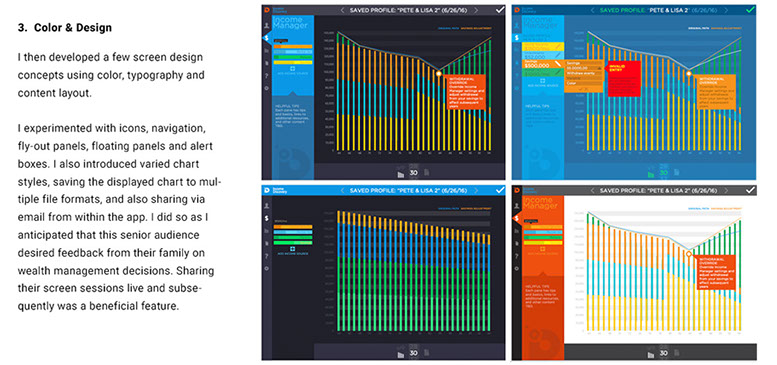
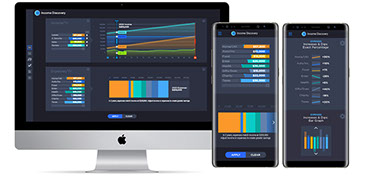
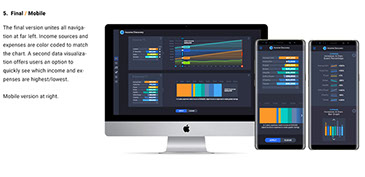
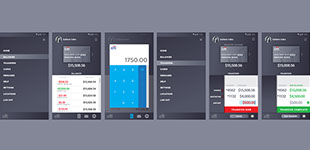
Data Visualization / Usability
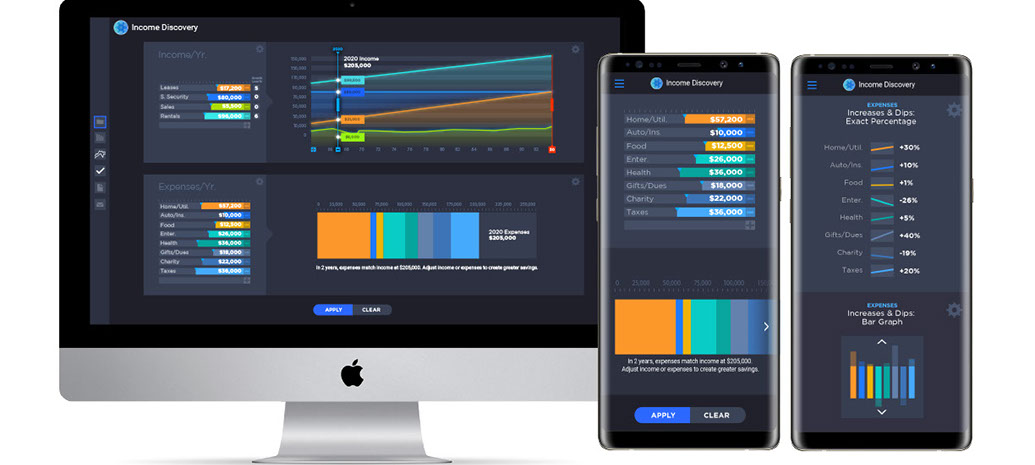
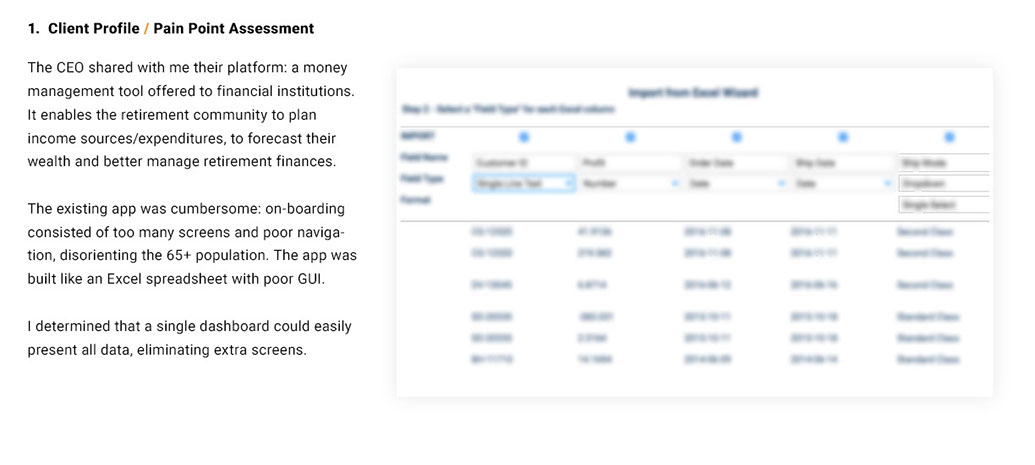
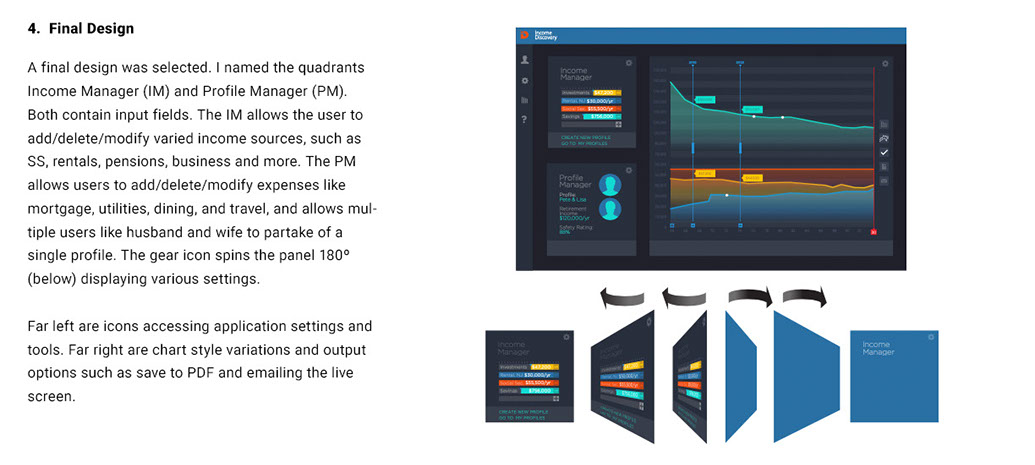
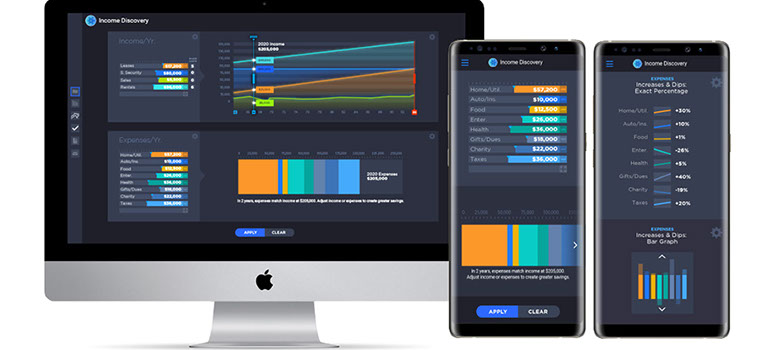
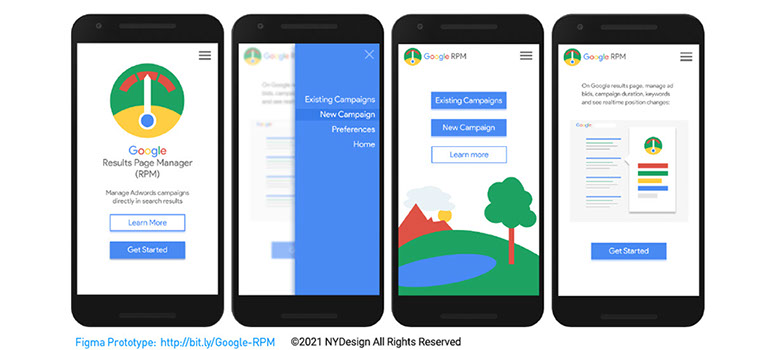
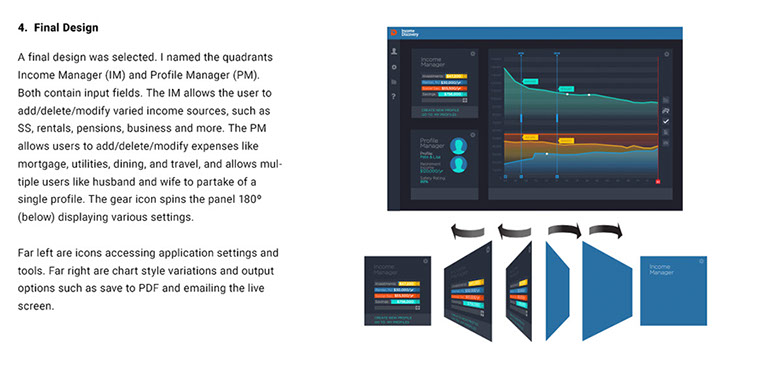
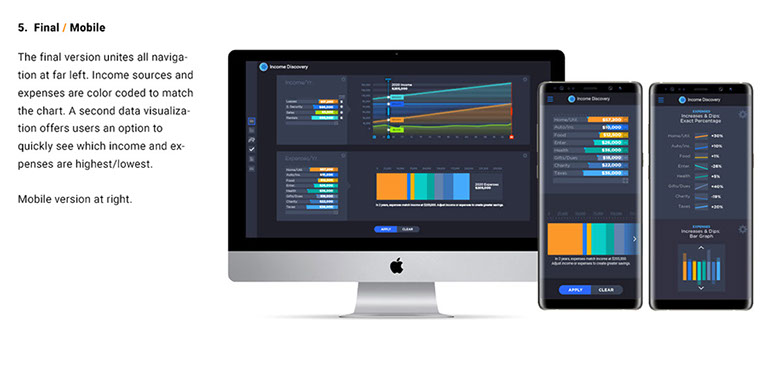
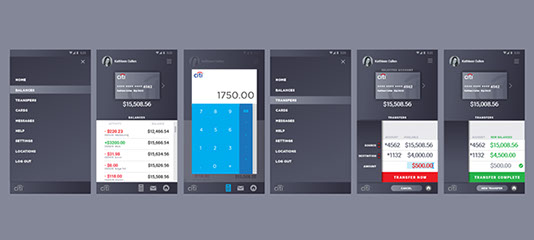
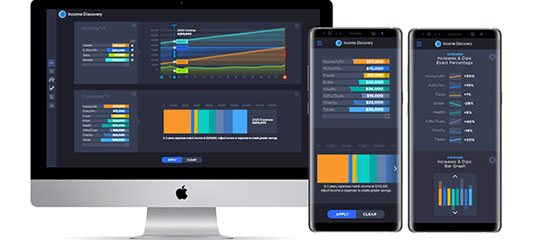
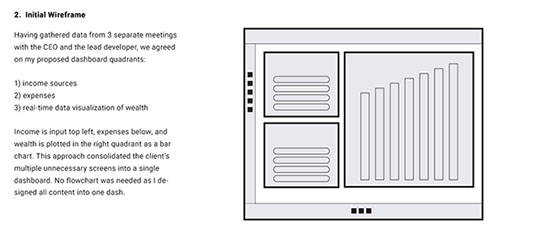
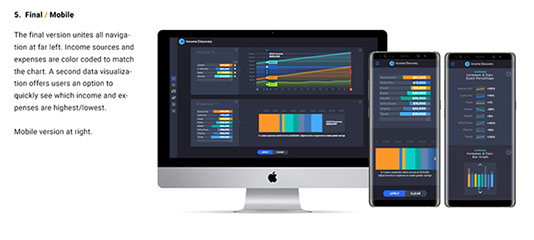
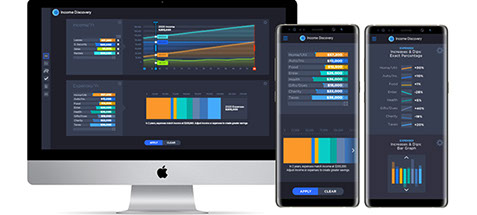
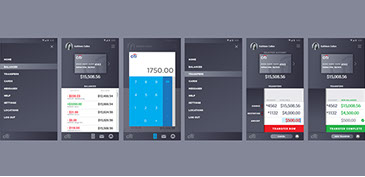
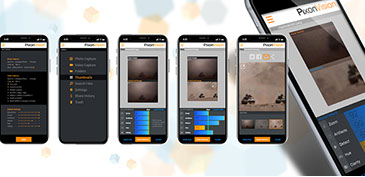
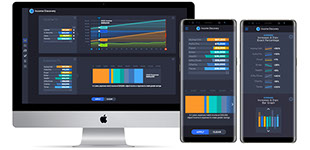
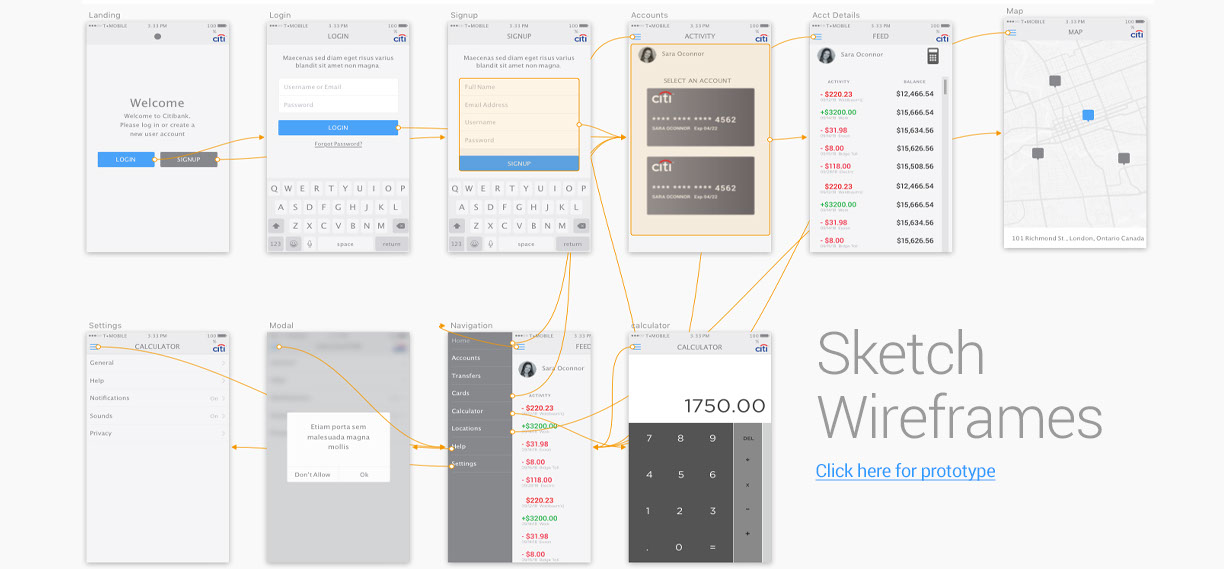
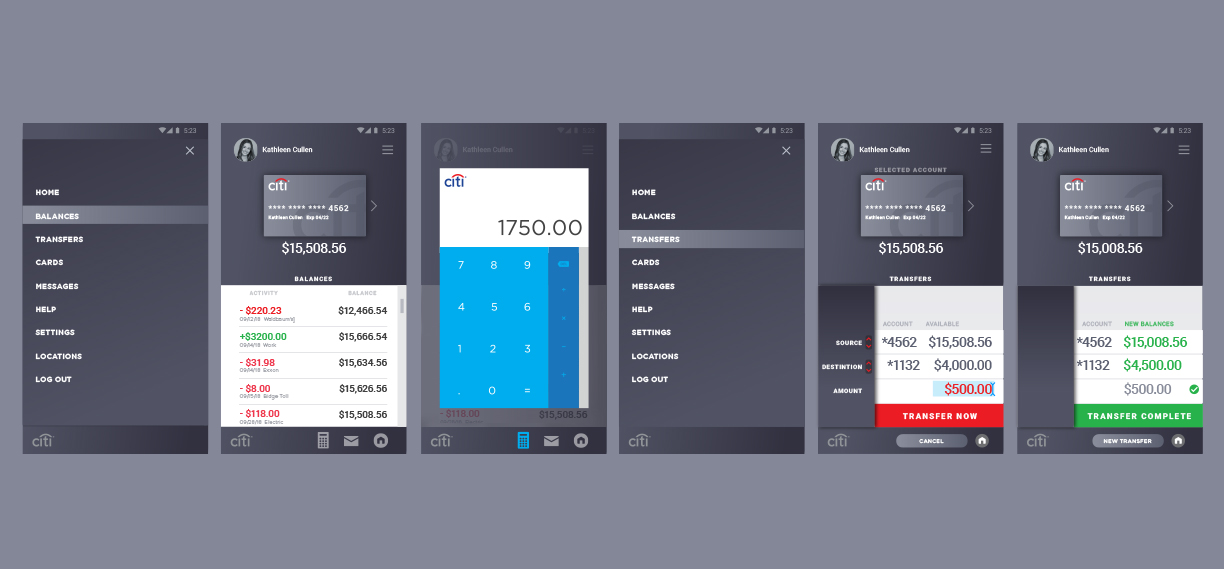
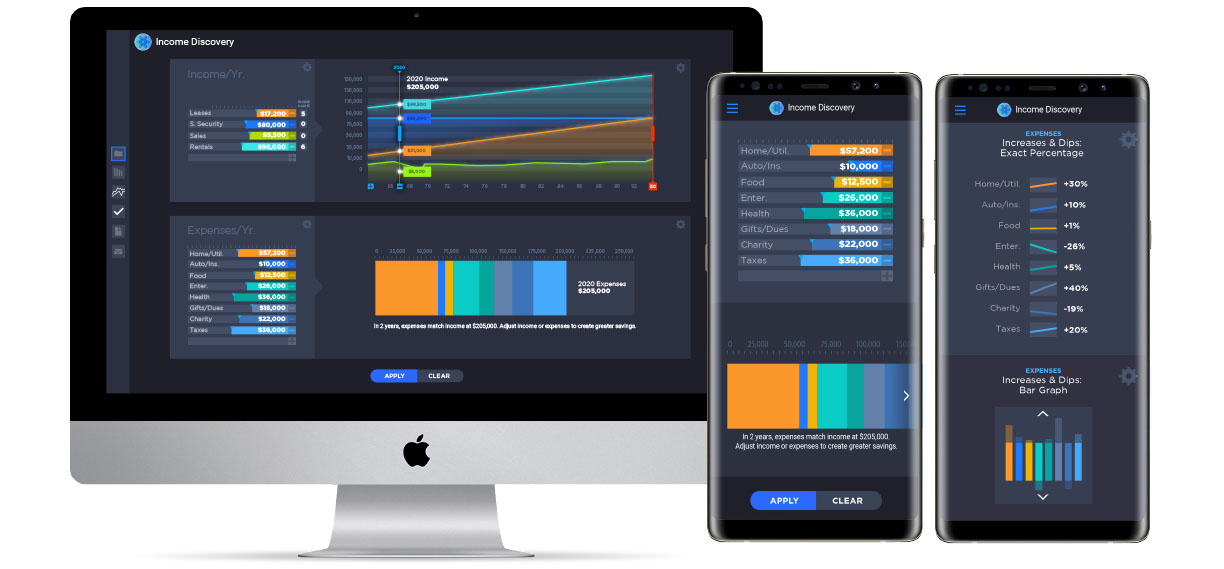
Money Management GUI: Simplify and beautify user experience while consolidating screens.
(Details below image)
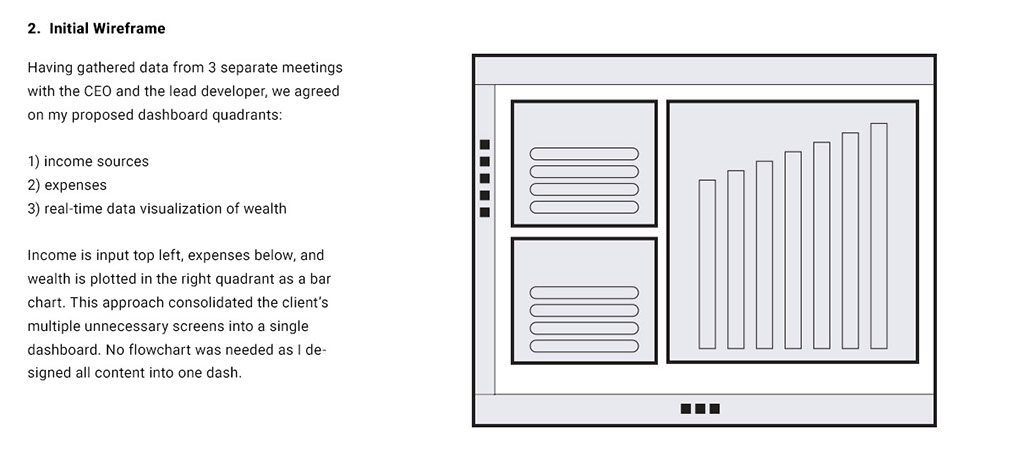
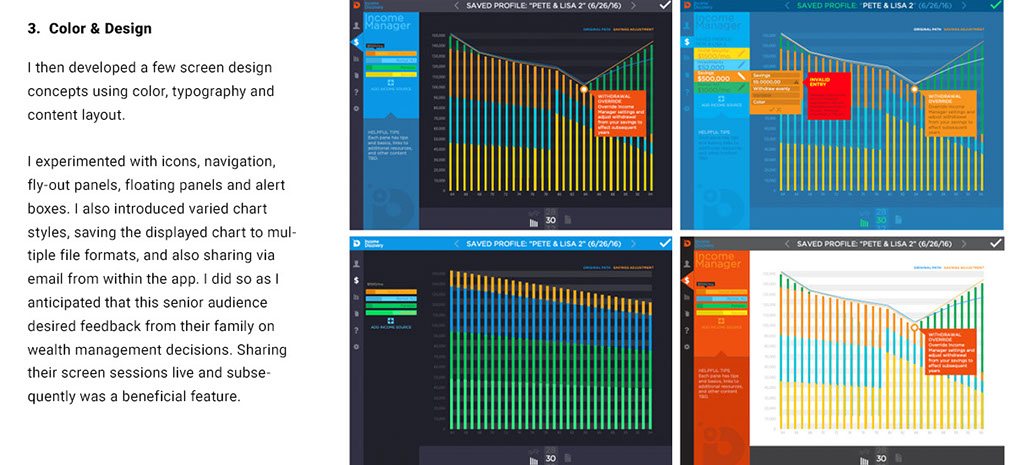
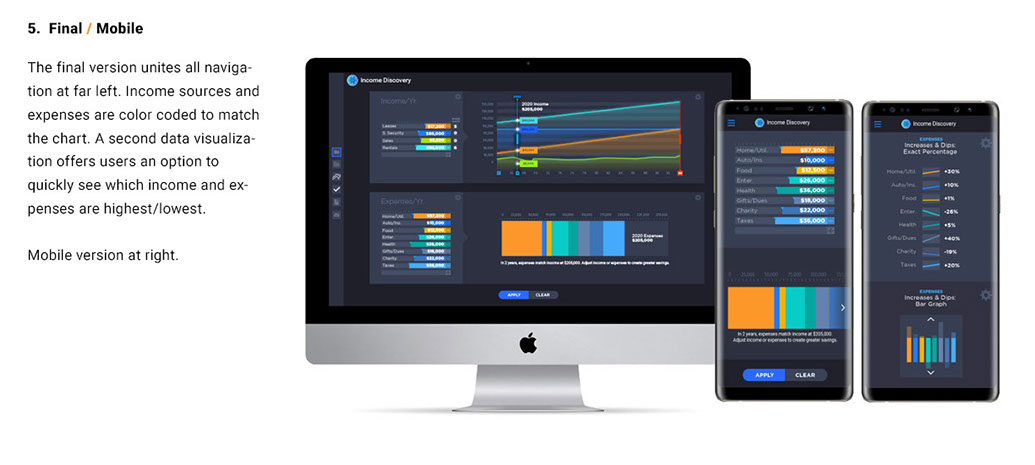
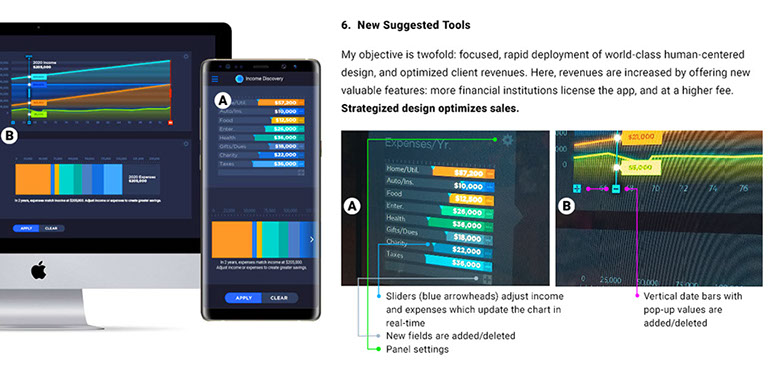
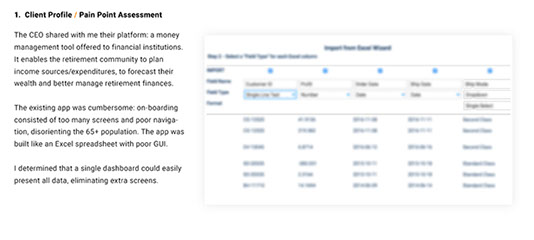
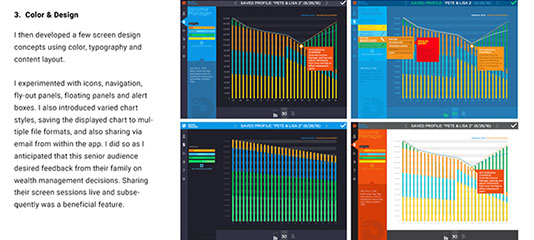
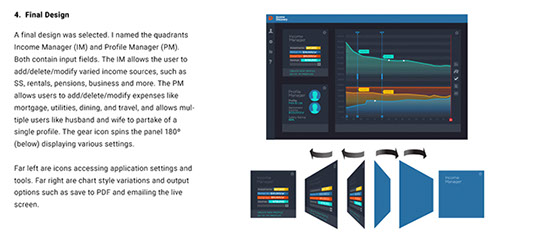
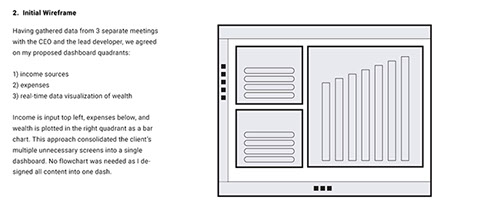
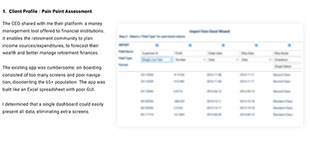
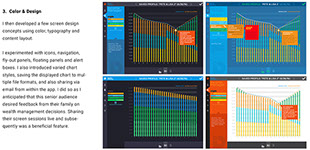
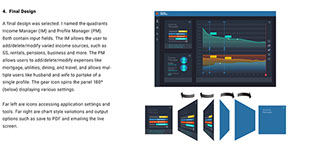
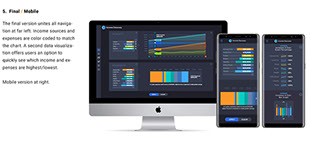
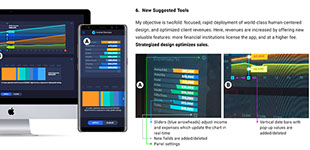
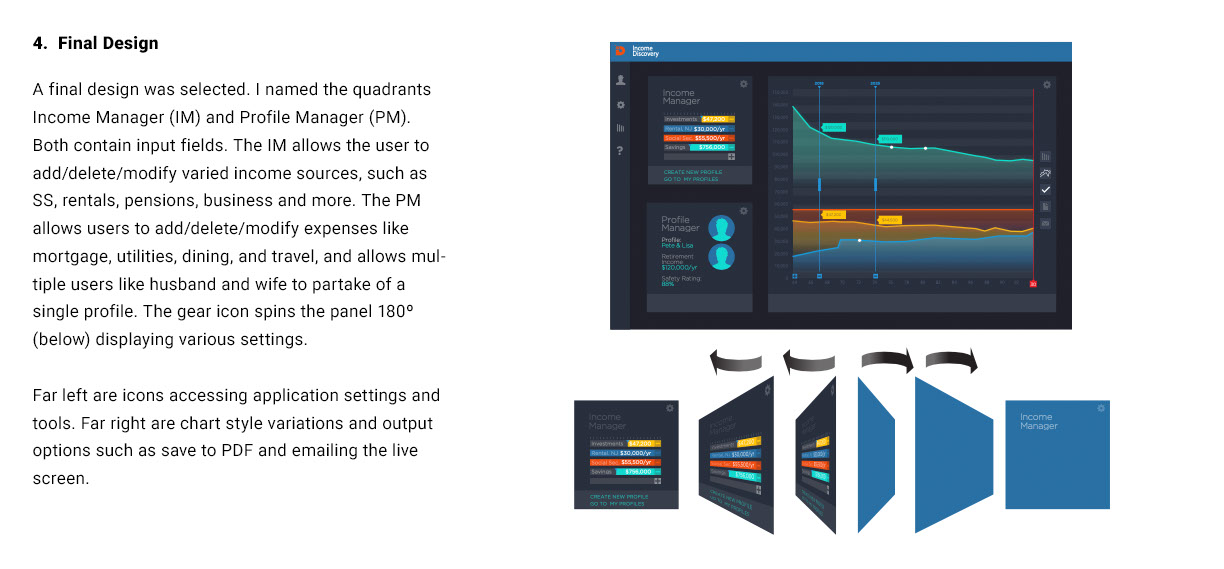
Typically, data is entered from a separate and more archaic “Excel” type interface. A new concept recently developed by NYDesign enables users to manipulate data directly on charts, with real-time feedback. As data is altered in any chart or settings area, data visualization reflects those updates in real time. Users can add and delete income sources, time-points (blue) to assess exact figures from various income sources, and drag the time-line (red) to alter the duration. Other features include a profile manager, new chart creation, chart comparison, help and settings. The lower navigation icons control alternate chart designs, save current chart, PDF creator and email charts. More user-friendly GUIs opens the doors to greater users of digital products, making data providers more profitable.
"Of 28,000 designers, NYDesign ranks #1 in New York and #10 worldwide."
(2017-2019)
Branding
UI/App Design
Wires/Prototypes
App Store Design
Dataviz/Charts
Infographics
Iconography
Illustration
Websites
Landing Pages
Editorial Design
Animation/Video
Presentations
Social Media
Advtg/Promo
Packaging